
On this page
How to use AI Model History
When you are choosing a model, what do you actually look at?
- Is anyone else using it?
- Is it the one people keep coming back to?
- Is the attention fading?
One number you will check is its Hugging Face likes.
A like count by itself is only a snapshot. A model can have thousands of likes and barely be gaining any more, or it can be young and climbing fast. You cannot see that from the number alone. AI Model History draws the curve: how a model's likes grow as it gets older. It is free to use, and the likes come from Hugging Face.
User Manual

It is a search box. Type a model, click Plot, and the curve shows up. A few controls around that box cover the rest:
- How to add a model using 3 different formats.
- How to add multiple models.
- How to switch the chart view.
- How to temporarily show or hide a model.
- How to embed a live chart in a README.
- How to embed the rank badge.
How to add a model using 3 different formats

Type into the box, then press Enter or click Plot.
- The usual form is the author, a slash, and the model name. For example,
deepseek-ai/DeepSeek-R1. - When the author and the model name are the same word, the short name is enough.
my-modelis plotted asmy-model/my-model. - You can paste several models at once, separated by commas.
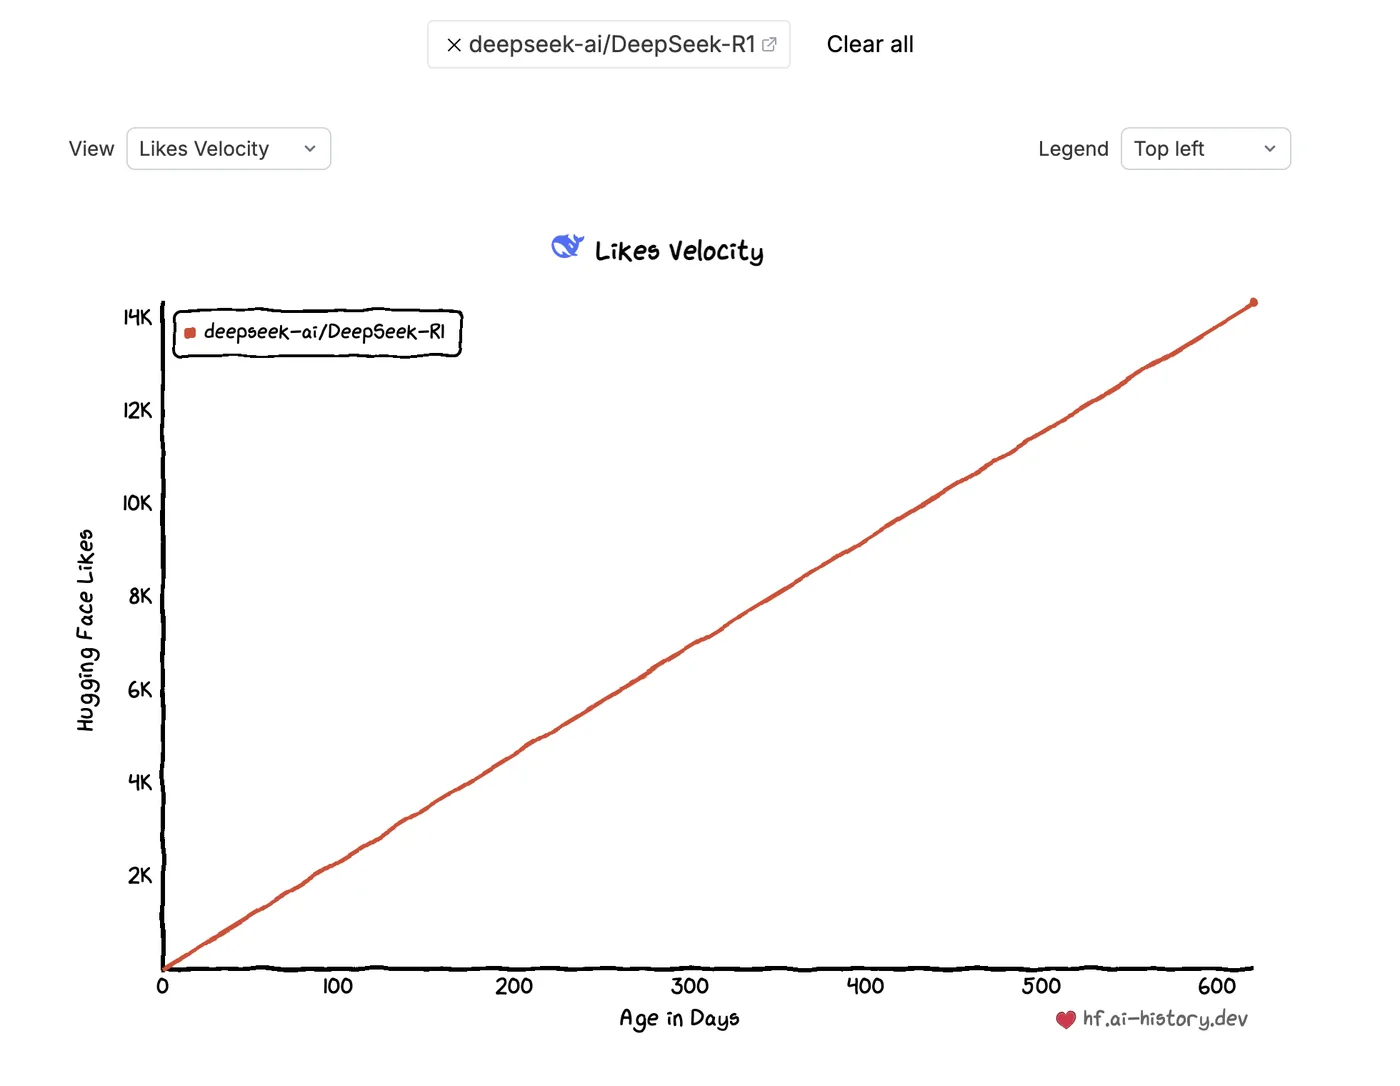
Leave the box empty and click Plot, and the chart draws deepseek-ai/DeepSeek-R1.
The model appears as a chip under the box. The small arrow on the chip opens it on huggingface.co. With one model on the chart, its avatar sits beside the title Likes Velocity. The vertical axis is Hugging Face likes, and the horizontal axis is the model's age in days. The heart next to hf.ai-history.dev is the site mark.
How to add multiple models
After the first model is on the chart, the box reads ...add next model. Type the next id and plot it. Every visible model is drawn together.
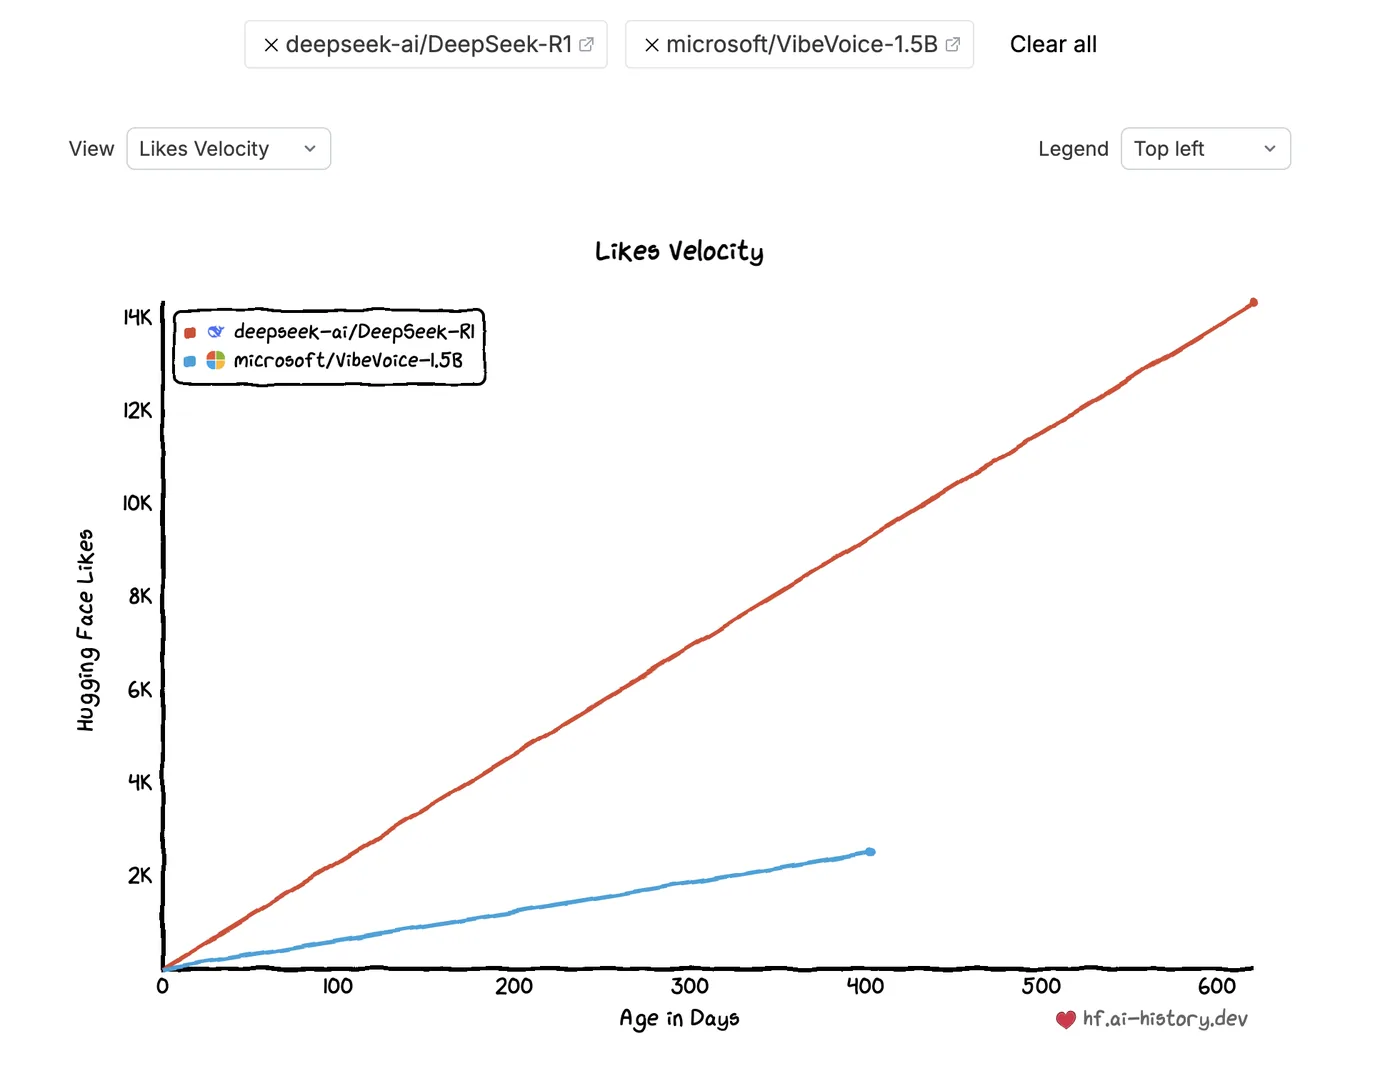
Here deepseek-ai/DeepSeek-R1 and microsoft/VibeVoice-1.5B share one chart. DeepSeek-R1 is the older of the two and sits higher, up around 14k likes. VibeVoice is younger, so its line ends sooner, and it is still climbing through the low thousands. Once a second model is on the chart, the avatar leaves the title, so the lines are what you compare.
How to switch the chart view
View, above the chart, switches the drawing.
Likes Velocity is the curve above. Legend on that view moves the key to the top left, the top right, or the bottom right.
Adoption Matrix places the same models by likes and downloads. Log scale appears only in this view. The dashed lines are the medians of the leaderboard.
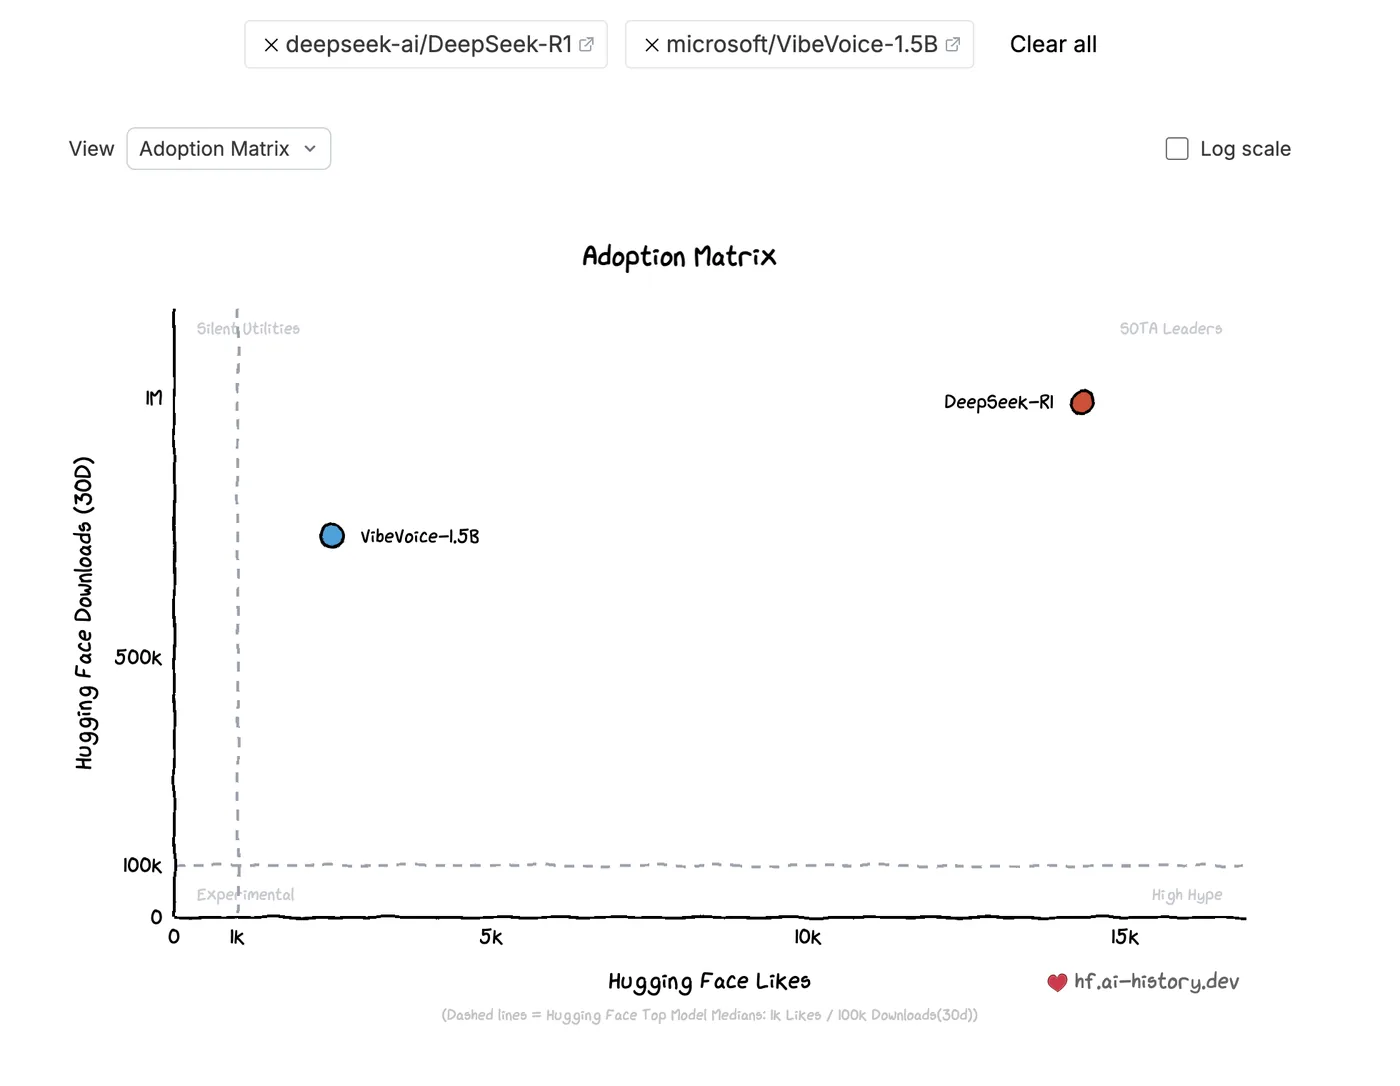
On this matrix, DeepSeek-R1 lands in the upper right, among the models with both more likes and more downloads. VibeVoice sits lower and to the left.
How to temporarily show or hide a model
You do not have to remove a model to set it aside. Click its name on the chip. The name is crossed out, and its line leaves the chart. Click the name again and it comes back.
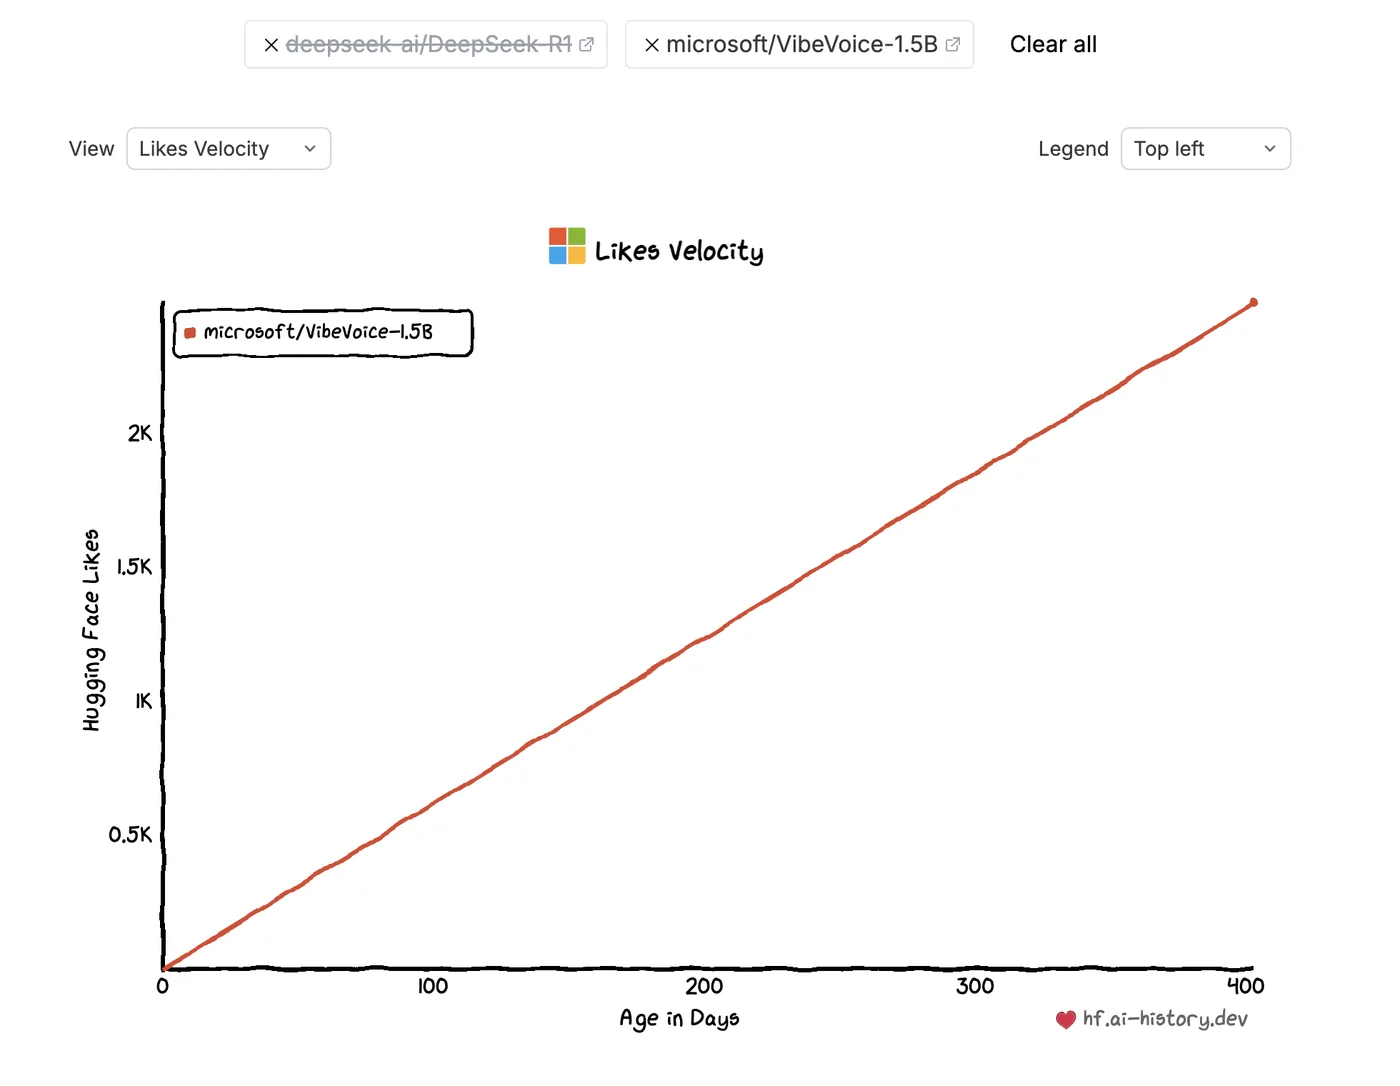
In the picture, DeepSeek-R1 is hidden, so only VibeVoice is drawn. With a single model visible again, its avatar returns beside the title.
The × on a chip removes that model. Clear all removes every chip.
How to embed a live chart in a README
Under the chart are Image, CSV, Link, and Share, and below those the snippet you paste into a README.
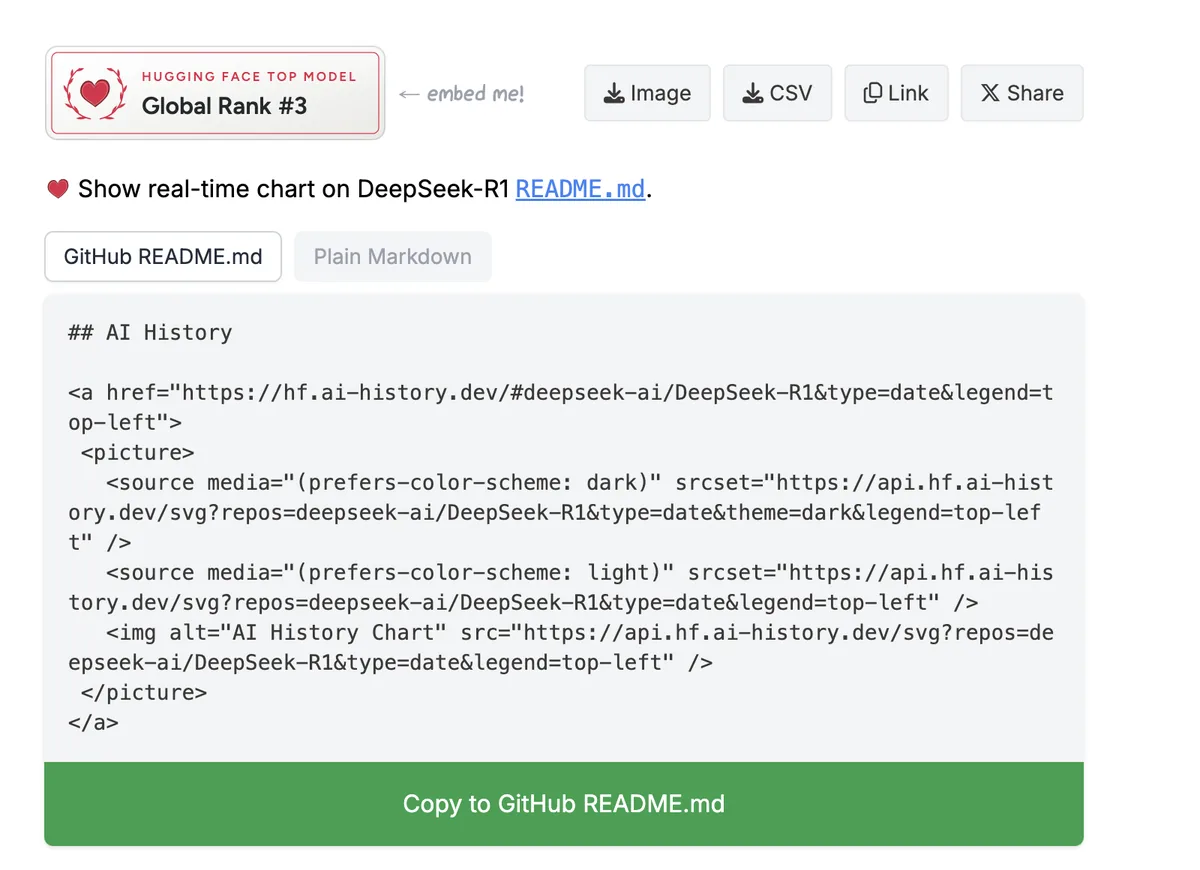
- Plot the model or models you want in the picture.
- GitHub README.md is HTML. It serves a dark chart and a light chart, and the picture links back to this page. The button reads Copy to GitHub README.md.
- Plain Markdown is one image link. The button reads Copy.
- Paste the snippet into the README. The image is drawn when the page loads, so the curve stays current. The heading in the snippet is AI History.
Image downloads the chart. CSV downloads the series. Link copies the address of this chart. Share opens a post on X with the like count, the model on huggingface.co, and a link back here.
When the chart has one model and that model is on the leaderboard, the rank badge sits to the left of the buttons, with ← embed me! beside it. Add a second model and that badge hides. The snippet itself still works.
Rank badge
← embed me! opens that model's page on the Badges tab. You can also open the model and choose Badges yourself.
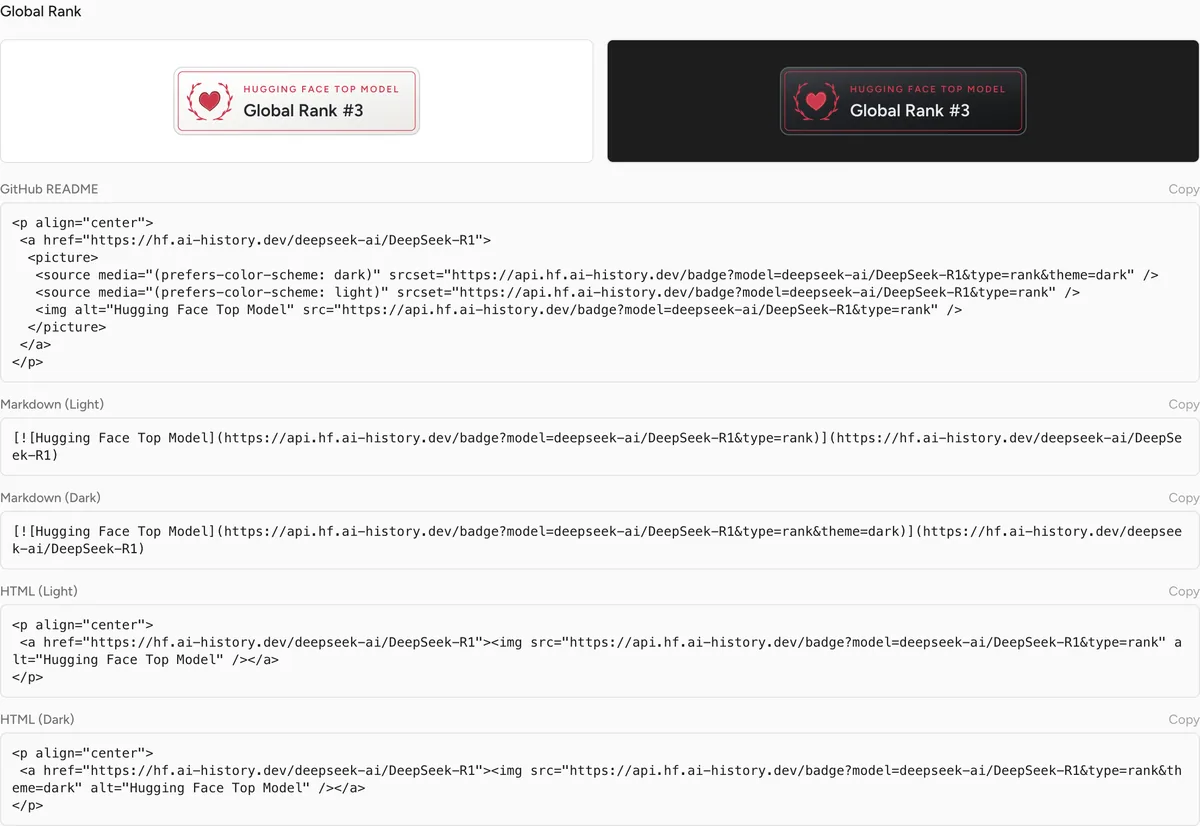
The page shows the badge in light and in dark, then the snippet for a GitHub README, for Markdown, and for HTML. Copy the one you need. It links to the model page and shows the global rank.
Overview on the same page is the model's card: the adoption chart, likes, rank, downloads, and the rest of the stats, with Image and Share under it.
Plot a few models and see which curves are still climbing. Questions and ideas can go to @HiroGuo12986.